Open marble maps on your computer and select the atlas map with the globe projection and use this to help identify places on the maps you are analyzing. You may also want to use the "earth at night" map to locate cities and towns where people are concentrated.
 To open Marble in the computer lab, in the start menu go to "my computer", open "Local Disk C" (you may need to click on "Show the contents of this folder"), open the "Program Files" folder (you may need to click on "Show the contents of this folder"), open the Marble folder and click on the compass icon to open the program (looks like the picture on the left). You can also download the Marble QT program and install for free on your own computer at http://edu.kde.org/marble/download.phphttp://edu.kde.org/marble/download.php
Assignment:
Break into groups and on one sheet of paper, write the title "Exercise: Population Maps", today´s date, and everyone's first and last name at the top.
Write down the number of the map and then explain how population is shown on the maps below. What information does the map communicate and how is it represented?
1.

2.

3.

Dot density map. Each dot represents 100,000 people.
4.
4.

5.

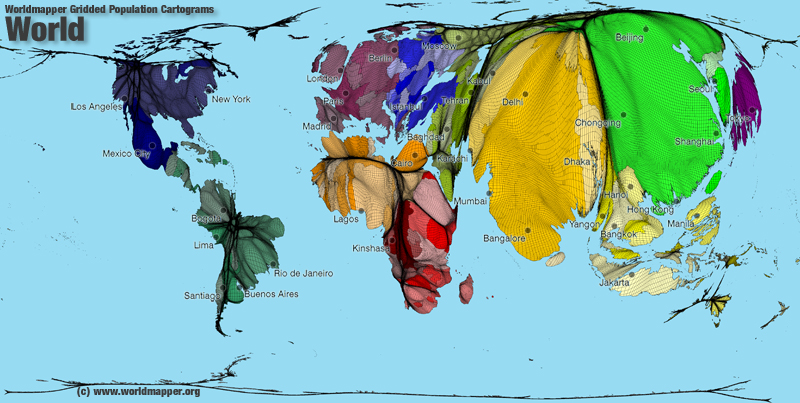
Cartogram of world population.
The size of each territory shows the relative size of the population living there. Big territories have a lot of people. Small territories have few people.
6.
7.

8.

9.

references:
http://www.zonu.com/http://www.worldmapper.org/display.php?selected=2
http://www.worldpopulationatlas.org/
http://www.populationlabs.com/
http://www.mapsharing.org/MS-maps/map-pages-worldmap/images-map/9-world-map-population.jpg
No comments:
Post a Comment